Event Summary:
The late June heatwave that gripped the Pacific Northwest and southwestern Canada for several days didn’t just break numerous all-time records; it shattered them. Sadly, over 1,400 deaths were attributed to this heatwave, the result of unprecedented high temperatures in an area unaccustomed and ill-equipped to handle the heat of this magnitude.
While long-range forecasts (CPC) were confident in a period of above-normal temperatures, the true scope of the event was much slower to come into focus in both automated forecasts and those with human intervention. Understanding the nuances in how various models and providers captured the forecast in the days leading up to the multi-day event can allow for better preparation in the future.
Forecast Analysis
ForecastWatch analyzed the performance of forecasts from various forecast providers up to sixteen days in advance of the core of the heatwave, June 25-30, in addition to forecasts from the long-range computer model from the United States, the Global Forecast System (GFS) model for these dates.
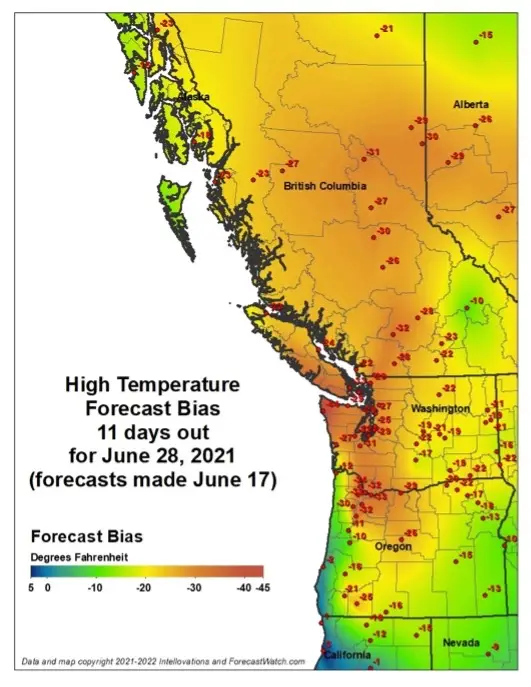
At eleven days out, there were widespread negative biases (predicted temperatures are too low) between 20°F and -45°F across much of western Alberta, much of British Columbia, western Washington, and much of Oregon.
The US global forecast model (GFS) was the first to pick up on the building ridge that would set the stage for the dome of hot air that would settle over the region. From indicating a ridge beginning to build at nine days out to forecasting temperatures within 1°F of the actual high temperature every day between a week out and two days out, the GFS showed remarkable accuracy and consistency in its predictions for this event.
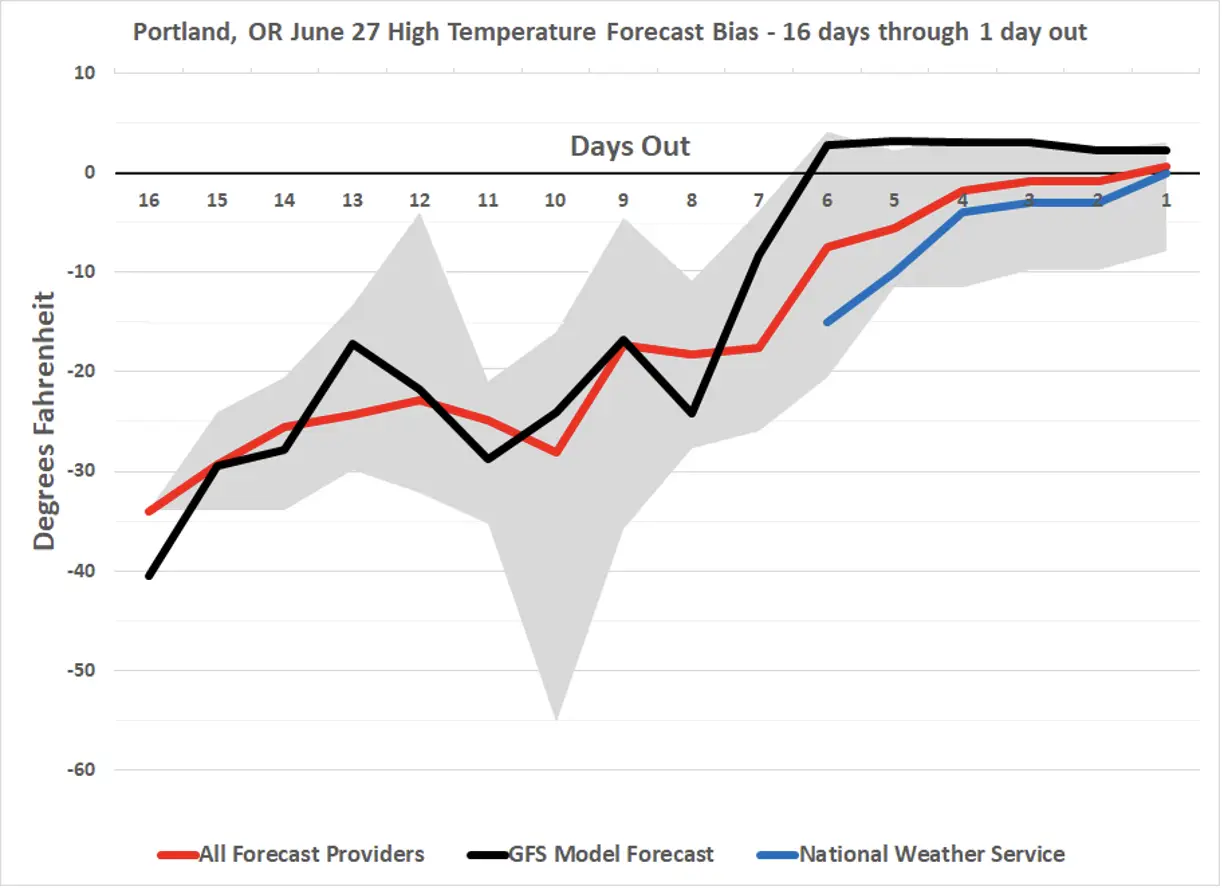
In comparison, the sixteen forecast providers’ predictions as well as the National Weather Service (NWS) forecasts that ForecastWatch analyzed, were much slower to catch on the anomalous event, especially those with more human input, as shown in the graphic below. Those providers and the NWS, while increasing their high-temperature forecasts slowly, remained too low even through one day out from the hottest days – it was a risk to forecast extreme heat on a scale that had never occurred.
Impacts
The impacts of the extreme heat of this magnitude cannot be understated – on humans, the environment, and infrastructure alike. Repeated days of temperatures several degrees above the all-time record, with little relief from still-warm temperatures at night in a region where less that 40% of homes have air conditioning left residents coping with dehydration and heat-related illnesses. This is likely to lead to an increase in patients in hospitals and healthcare facilities, potentially overwhelming the system.
Critical infrastructure such as railroads, roadways, and air travel are all impacted by extreme heat, leading to significant delays in both individual movements and the movement of commercial goods. Utility companies may be forced to implement rolling brownouts, cutting electricity to consumers due to high demand overwhelming the system.
Extreme heat and dry conditions go together, often leading to enhanced drought conditions over the same region. This creates an elevated risk of wildfires, which would create a cascading effect of negative impacts related to all the aforementioned risks (poor air quality impacting health, wildfires impeding traffic, etc.).
How Industries Benefit From Understanding Forecast Accuracy
ForecastWatch’s comprehensive analysis of forecasts leading up to this event shows the importance and usefulness of understanding biases in both fully automated forecast models as well as predictions issued by weather providers.
Energy trading companies, as well as utility companies, employ meteorologists who can review comprehensive reports like the one ForecastWatch put together on past events like the Pacific Northwest heat wave and utilize that knowledge to make informed decisions for the next major event.
Forecast providers, especially those with more human intervention in the forecasts can learn from the analysis of this event, better understand potential blind spots, and make improvements to the forecast editing process. As the climate continues to change and anomalous events become more frequent, recognizing how forecast models handle them will be critical for accurate predictions.
To download the full 36-page report, which includes an in-depth analysis as well as site-specific data and graphics for seven representative locations across the region, click here.
